Professor, a MongoDB Profile Viewer
I presented Professor, my MongoDB profile viewer and analyzer, this past Tuesday at the New York MongoDB User Group. Professor aims to use the new features in the MongoDB 2.0 profiler to make profile information intelligible and actionable. It's open-source (BSD-licensed) and written in Python and Flask.
10,000 Feet
The primary design goal of Professor is to give you at-a-glance information about the performance of your queries (and, ultimately, updates and commands, though these are not yet supported). It presents a dashboard-style interface showing the worst-performing queries first, with aggregate timing information and a mini-histogram:
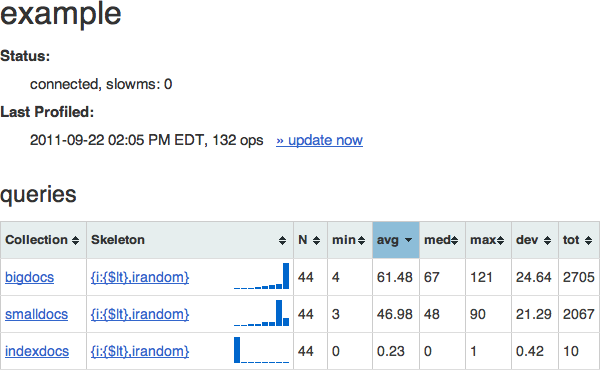
Here you can see that there are 3 collections in this example database, and one query that we've seen for each. The "skeleton" of the query is essentially the query without any values. Skeletons preserve the structure of the query and allow Professor to group same-structured queries together, to present their information in aggregate, even if the queries used different values.
Immediately to the right of the skeleton is a log-scale histogram of the query times: the leftmost bucket represents queries that ran in less than 1ms, the next queries that ran less than 2ms, then 4ms, 8ms, etc. When using professor, you want to see histograms like the one for "indexdocs," which shows that all or nearly all queries executed in less than a millisecond.
Zooming In
You can click on the collection name to see only queries for that collection (along with some collection-specific information: number of documents, average size, total storage size, and the indexes that exist on the collection), or you can click on the query skeleton to see all queries collected which match that skeleton, and the time each one took to execute:
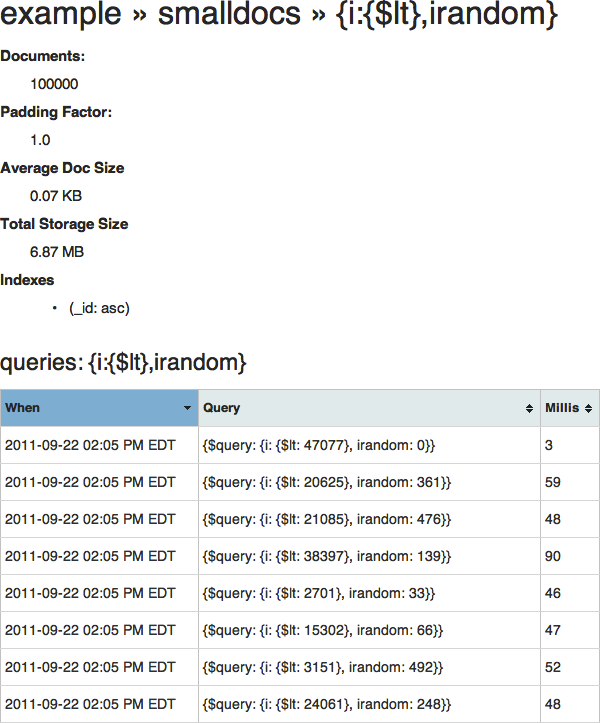
(Here you can see more clearly how the actual queries translate to the skeleton above.)
So why are these queries taking so long? (Yes, even 3 milliseconds counts as "long"!) This page gives you all the information you need. (Hint: take a look at the number of documents and at the indexes).
Under the Hood
Professor attempts to limit its impact on your running database -- after all, one of the situations where you might need Professor's help is when your database is performing badly (although you should have investigated your slow queries far sooner!). Rather than repeatedly querying the system.profile collection, Professor makes a local copy (preferably into a separate mongod instance running on another server), and uses that database to serve all the web pages.
Every time an update command is issued (either by clicking the "update now" link on the dashboard, or by the profess command line script), Professor connects to the target database, queries only for system.profile documents newer than the last time it looked, processes them (this is when Professor generates the skeleton) and inserts them into its local store.
Professor's Future
Professor is a work in progress. Here is a laundry list of features I hope to add, in no particular order:
- Support for other operation types (as I've already mentioned)
- Use update modifiers (
$incand friends) to generate aggregate statistics during profile intake, rather than on page generation - Use AJAX or simple page reloads to turn the static web view into a periodically-updating live view (like the UNIX
topcommand) - Show other fields on the query list (
nscanned,ntoreturn,nreturned,scanAndOrder, etc) - Ability to replay a query with
explain()to get more detailed information, such as what index, if any, was used to service a query
Or, nudge nudge, you could fork Professor on GitHub and help me work on some of these yourself!